SECTION II ENGINEERING STUDIES AND
CRITERIA FOR SETTING SPEED LIMITS
MDT’S claims and the Rational behind Governing Law?
Neither of the following statements is true in regards to contextual use of statutorily required engineering studies and applied findings to establish speed limits.
“three, both MDT and FHWA have documentation on the engineering studies done as part of the Statutory process.”
SPEED LIMIT FACT SHEET
MAY 2001
“The reasonable and prudent provision became an issue because of noticeably higher speeds, greater variances in speed between vehicles and the corresponding risks for motorists. In response to those concerns, MDT reviewed crash and fatality statistics, conducted traffic counts and prepared engineering studies for the 1997 and 1999 Montana legislatures.”
First, the above referenced reports submitted to the FHWA were for NHTSA’s compliance reports to Congress. These reports are legacy remnants of the repealed National Maximum Speed Limit; quarterly samples of traffic speeds from a token number of monitoring sites. One FHWA source said they didn’t believe they were required at all anymore.
These reports to the FHWA were 24 hour, all traffic, not free-flowing, with no separation by vehicle classification… and if on report-day speeds were reduced because of bad weather, it didn’t disqualify the data under the rules. There were many other such legal beneficial exceptions in these report parameters. The object was low numbers, not what traffic was in actual fact doing. NHTSA also wanted the lowest possible numbers reported so they could claim their programs were working, regardless of the truth. After the repeal, the object of the game had changed. By showing increased speeds these reports become fodder for the new rallying cry that a new crisis was at hand. Substantiation for more NHTSA program intervention; new rounds of funding to its enforcement constituents - same game – new names for speed enforcement.
Did anyone who drives really believe half the nation was driving slower than 55 mph on the interstates and primary highways? This is exactly what NHTSA reported to Congress for 20 years! Therefore, any direct correlation of this before and after data is evidently suspect. The one thing we do know is that traffic speeds have been increasing since the automobile was invented proportionally to road and vehicle improvements, at a rate of approx. 1/2 mile per hour per year. Therefore the 3-5 mph increases were within expectations because of this change in reporting emphasis and time elapsed.
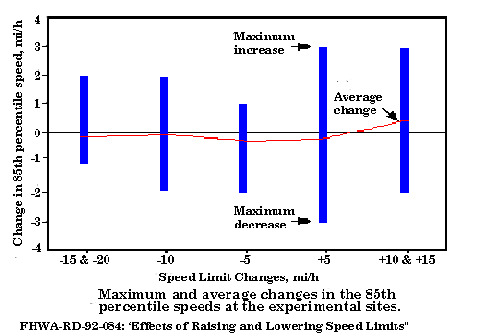
The following chart shows that even where limits are posted, speed changes little regardless if limits are lowered or raised. Likewise as in Montana’s case, they changed little even when your limits were removed altogether. This FHWA study included 20 states and over a hundred experimental sites where the limits were lowered as much as 20 mph and raised as much as 15 mph. Each site was monitored 3 years prior to and after the changes were made. After being lowered some speeds went up, and after being raised some went down. On average there was less than a 1 mph change overall. The finding as always, posted limits have negligible effect on actual traffic speeds.
The FHWA has no other vehicle speed reporting requirements. This statement “done as part of the Statutory process” to set speed limits is simply false.
Second, these reports were not engineering studies as prescribed under governing federal law to establish the speed limits that were set. The truth is MDT made their claims without any factual findings. Even today, 2 years later, there is no evidence that they have yet to conduct them.
The Governor, State AG and the Chief of the Highway Patrol had embarked on a statewide PR campaign to convince the public (read legislature) that arbitrary statewide statutory limits (illegal) were needed for safety (read revenue). MDT’s presentation to the legislature was an unfounded lobbying campaign using the credibility of a purported factual state agency to support the Governor’s (et al) agenda – nothing more. It could be said, this was a gross miscarriage of process to get speed limits posted on all of Montana’s highways as quickly as possible, regardless of the facts or law for that matter.
What’s most conspicuous by its absence? Is the fact that they didn’t ask for the money this process would need to comply with governing law; viz. the required engineering studies on a road-by-road, section-by-section basis to first determine if the limits were warranted. And then if warranted, what numeric value to post based on the data separated by vehicle classification and hour of the day for each section, comparing accident data, hazardous terrain features etc. However, the report did use engineering terms: the 85th percentile speeds, speed variance, highest speeds etc. in inappropriate context.
These safety reviews should already be part of MDT planning, on a recommended 5-year review cycle with provisions to respond to location specific notices of defect, new roadside development, roadway expansion or increased highway service levels. That being said, it doesn’t appear that MDT is currently staffed or funded in its traffic engineering study department to take on such a detailed road-by-road statewide task.
Why is such a complex study required to encompass every mile of highway in the state? Because there is no requirement to post a limit unless a engineering study identifies a problem that this device, at this location, would be effective in reducing its identified germane too low or excessive speed or speed variance accidents. Montana chose to post limits on all its highways with added burden of separate requirements by vehicle classification and time of day. Accordingly under governing law, each element requires its own independent factual basis to be legal, for each section of highway being posted.
Primary Tenets and Rationales in regards to speed limits:
The following is an excerpt from a speech given to engineers about their responsibilities in establishing proper and realistic speed limits. The following was accredited to Mathew C Sielski; bestowed the highest honor that the Institute of Transportation Engineers can give for lifetime achievement to their profession. The often-quoted text below can be found in many state DOT handouts and websites.
“One of the most important responsibilities of traffic engineers is the establishment of proper and realistic speed limits. Our profession has long recognized that most citizens will behave in a reasonable manner as they go about their daily activities.
Thus, traffic laws that are based upon behavior of reasonable motorist are found to be successful. Laws that arbitrarily restrict the majority of motorist encourage wholesale violations, lack of public support, and usually fail to bring about desirable changes in driving behavior. This is especially true of speed limits”.
“Our profession, since the early 30’s, based its speed zoning techniques on several concepts deeply rooted in our American system of government and law, namely:
1. Driving behavior is an extension of our social attitude, and the majority of drivers respond in a safe and reasonable manner, as demonstrated by their good driving records.
2. The careful and competent actions of a reasonable person should be considered legal.
3. Laws are established for the protection of the public and the regulation of unreasonable behavior of an individual.
4. Laws cannot be effectively enforced without the consent and voluntary compliance of the public majority.”
“Our profession also recognizes that an emotionally aroused public will reject these fundamentals and will rely on more comfortable and widely held misconceptions, such as:
1. Speed limit signs will slow the speed of traffic.
2. Speed limit signs will decrease accidents and increase safety.
3. Raising a posted speed limit will cause an increase in the speed of traffic.
4. Any posted speed limit must be safer than an unposted speed limit, regardless of the prevailing traffic and roadway conditions.
Before and after studies have proven conclusively that these are definitely misconceptions. Unfortunately, in too many instances influential pressures succeed in the application of such unrealistic regulations.”
No matter how many times the findings have come to the same conclusion over the last 70 plus years, lay people and politicians cannot accept these truths. To assure this fact is kept quiet, NHTSA blocked the findings of an FHWA study from being published for 5 years because it too came to the same conclusion.
Here is how it was expressed in the 1930’s. Large numbers of violators indicates an engineering failure rather than an unsafe and out of control public. In today’s news from Washington DC, a single vehicle using photo radar was able to issue over 200 citations in a few hours. The large numbers here are an indictment that sound practices have not been followed and that the city is profiteering from non-complying and unsafe practices. Large or small the numbers, for profit (not safety) enforcement practices are contrary to our We The People core beliefs. Here is the 1989 FHWA document that cited the relevant 1930 quote.
"Motorist Compliance With Standard Traffic Control Devices", April 1989
Publication No. FHWA-RD-89-103
US Department of Transportation
Federal Highway Administration
Excerpt:
"The compliance situation was summarized in a Highway Research Board paper presented by Burton Marsh in 1930 [Marsh, B. (1930). "Law Observance and Enforcement methods", from Highway Research Board Proceedings. V.10, Washington, D.C.]:
"The status of traffic law observance in any community is definitely related to a number of ... factors. Important among these factors are:
1. Reasonableness of traffic rules and regulations. It is well known that good observance can only be expected for regulations which are generally deemed sensible, necessary and reasonable. They should also be as simple and as few in number as possible. The Uniform Vehicle Code and the Model Traffic Ordinance constitute valuable guides to states and municipalities in setting up reasonable regulations.
2. Effective and sensible signs, signals and markings, wisely used.
3. Adequate public understanding and appreciation of traffic regulations, of the reasons for them, of the results to be accomplished, and of methods of proper observance.
4. Uniform, impartial and business-like enforcement.
To enforce traffic laws is to compel obedience of them. The fact that so much compulsion seems necessary is a clear indication of serious deficiency in one or more of the first three factors presented above. Thus, although enforcement should only be necessary for a small perverse minority, it is all too much invoked for large proportions ... The really needed steps to reduce violations are the effective promulgation of reasonable regulations and the education of the public as to the saneness, necessity and value of them and as to how the individual is expected to act in compliance with the said laws."
“These words are still true today. In general, motorists noncompliance is indicative of a problem. The problem may be due to some failing on the part of the traffic engineers or the lack of understanding of the driver, but seldom is the problem a wanton disregard of the law by the motoring public. In light of this and the other conclusions reached, the following recommendations are made."
Further, there are real dangers in allowing the unfounded conjecture of well meaning people to make safety decisions or laws when we have an established science to guide us. The unintended consequences are real and they do increase accident rates. Nebraska was one of the states in a larger FHWA study and they wanted an independent verification. Like most state DOTs, they are responsible for state highways that pass through local communities; and in every case the local communities demand lower limits. They simply needed to know what the right policy is. “Reasonable” speed below is defined as the 85th percentile of free-flowing traffic.
Nebraska Department of Road, NDOR
University of Nebraska Lincoln,
Department of Civil Engineering College of Engineering and Technology:
Research Report No. TRP-02-26-92
Evaluation of Lower Speed Limits on Urban Highways:
“SAFETY EFFECTS
The results of the analysis of the accident experience in speed zones indicate that zones with posted speed limits equal to the reasonable speed limits proposed by the NDOT method of speed zoning are safer than zones posted with limits that are 5 and 10 mph below the reasonable speed limits. Speed zones with speed limits 5 mph below the reasonable speed limits were found to have 5 percent more accidents than zones with reasonable speed limits. Speed zones with speed limits 10 mph below the reasonable speed limits were found to have 10 percent more accidents than zones with reasonable speed limits. Therefore, the speed zones on state highways in urban areas should be posted with reasonable speed limits proposed by NDOR method in order to minimize the numbers of accidents in the speed zones. Speed limits lower than the reasonable speed limits should not be posted.”
MUTCD § 2B.11 Speed Limit Sign (R2-1) Statutory Requirements:
The question is, what are the statutory legal requirement that must be met before a speed limit sign can be legally posted? (also see page 10) Except for the addition of the new metric provisions the requirements remain the same.
1988 Edition of MUTCD
MUTCD § 2B–10 Speed Limit Sign, (R2–1)
The Speed Limit sign shall display the limit established by law, or by regulation, after an engineering and traffic investigation has been made in accordance with established traffic engineering practices. The speed limits shown shall be in multiples of 5 miles per hour.
Millennium Edition of MUTCD
Section § 2B.11 Speed Limit Sign (R2-1)
Standard:
After an engineering study has been made in accordance with established traffic engineering practices, the Speed Limit (R2-1) sign shall display the limit established by law, ordinance, regulation, or as adopted by the authorized agency. The speed limits shown shall be in multiples of 10 km/h (5 mph).
MUTCD § 1A.13 (definition of terms)
Engineering Study:
The comprehensive analysis and evaluation of available pertinent information, and the application of appropriate principles, Standards, Guidance, and practices as contained in this Manual and other sources, for the purpose of deciding upon the applicability, design, operation, or installation of a traffic control device. An engineering study shall be performed by an engineer, or by an individual working under the supervision of an engineer, through the application of procedures and criteria established by the engineer. An engineering study shall be documented.
MUTCD § 2B.12 Truck Speed Limit Sign (R2-2)
MUTCD § 2B.13 Night Speed Limit Sign (R2-3)
The statutory requirement for each speed limit sign (R2-1, R2-2, R2-3) is that an engineering study has found that it meets a specific need at this location, and if installed: it is accordance with accepted national engineering practice; that this number was chosen by the finding of fact, an articulated document of all factors considered and applied; with separate day and night studies for each classification of vehicle on each particular section of highway being regulated; and it is codified into law via an ministerial act.
As is readily apparent, the legislature in posting Montana’s limits, did not meet statutory requirements of the above governing federal law.
MUTCD § 2B.12 Truck Speed Limit Sign (R2-2):
Truck speed limits, size and general restrictions are set in most states based on unfounded fear and misinformation, in a large part most of this fear is generated by faux safety lobbyist, financially sponsored by the railroads… that about says it all. This will be a short overview.
Maximum truck speed limits should be set to minimize overtakings. The closer to the general flow of traffic the better. On higher density highways this has shown to reduce accidents rates.
Damage to highways. Yes, trucks do substantially damage highways; particularly asphalt ones. Being overweight per axel is a real road killer.
A study by the Minnesota DOT examining contributing causes to road damage, it found that slow moving trucks represent the greatest danger to the roadway surface during spring thaw and the threat is directly inverse to the truck’s speed. The slower a vehicle is traveling the more vertical the potentially destructive force is focused, at higher speeds the shocks waves travel parallel to the surface and spread out doing less damage. Structural roadway damage is at its least, when the roadway and subsurface is frozen solid.
The biggest potential offenders are ironically fire trucks with water tanks and sand trucks; they generally exceed vehicle weight regulations by several magnitudes over commercials trucks that are in violation of weight laws. Therefore serious consideration should be given to requiring sand trucks to have load dispersing tag axels. As for fire trucks, they are a necessity and because they drive so few miles, they pose no real threat.
Regardless of what you post your truck limits, actual speeds will not change more than a few miles per hour. Aside from the MUTCD, looking at contemporary truck engineering factors, a limit of 75 with a reasonable enforcement cushion is warranted.
MUTCD § 2B.13 Night Speed Limit Sign (R2-3):
Night speed limits in Montana are a legacy from another era established prior to contemporary statutory requirements. There are considerably more factors here to consider, and the current limits unnecessarily punishes too many that are in fact driving safely. More importantly, these limits are pure conjecture and have no engineering in-fact finding to support them, illegal. The following review touches on some of the less understood factors of night driving and their relationship to safety.
The ability to see at night has two primary components, the lighting system on your vehicle and the age of the driver. As aids, street lighting, color of pavement, retroreflectivity of signs and other traffic control devices help significantly.
The first issue will be the age of the driver. Your ability to see at night is directly proportional to your age. The younger you are, the better your night vision is. At age 60, it takes 10 times more light to perform the same task as someone 20. People drive at a speed they are comfortable with, and as you age you will drive slower and less at night, thereby compensating for reduced night vision. Here is the night vision chart.
The Benefits of Better Lighting, P-1211-A. Philips Lighting Co., 8/94.
Relative illuminance needed by different age groups to carry out a specific eye task:
Age Light Level
10 1
20 1.5
30 2
40 3
50 6
60 15
As the chart clearly demonstrates, age dramatically affects your night driving capabilities. Yes we do have a significant group of our driving population this is becoming a real issue (baby boomers), but rather than speed limits, this speaks to the need for engineers to pay more attention to better roadway delineation, sign size and retroreflectivity upgrading etc. Citing someone under 40 for driving safely, because their parents can’t perform the same task as well when they drive at night, isn’t equitable. Trust that people do on the whole act responsible and the low relative number of accidents compared to traffic volumes supports this thesis.
On the other hand, with the aid of technology the parents may now be seeing better than their children. Automotive lighting until the early 90’s remained the best technology that the 1930’s could produce. Today’s US automotive lighting, compared to just a decade ago, produces 2 to 6 times more light on the roadway. In addition, there is a whole new generation of night driving systems entering the market. The Cadillac Deville has a system that at age 60 will let you see deer at 5 times the distance of a 20-year-old using headlights. Better yet, the presence of deer or pedestrians is dramatically enhanced. By this fall there will be an aftermarket kit for trucks that will be available for general consumers. Even more advanced systems will be following shortly.
Other nighttime hazard concerns, namely animals crossing the highway. Under the MUTCD, the standard is to post warning signs directly proportional to risk. If you have a heavy migration area or open range where large herds congregate, mark those areas appropriately. When the hazard ceases to exist, the signs should be covered. A statewide year around limit is not an approved practice, its increases general disrespect for these traffic control devices, causing motorists to disregard them when they are posted where they’re really needed.
The following manual admonishment addresses this and myriad of other safety problems caused by inappropriate application of traffic control devices. Based on the too true fable, “Don’t Cry Wolf”, as the Nation experienced with a National 55 mph limit. It is not enough that signs look the same everywhere. The MUTCD prescribes not only the appearance of traffic control devices, but also their application:
MUTCD § 1A-2
“Simply stated, uniformity means treating similar situations in the same way. The use of uniform traffic control devices does not, in itself, constitute uniformity. A standard device used where it is not appropriate is as objectionable as a nonstandard device; in fact, this may be worse, in that such misuse may result in disrespect at those locations where the device is needed.”
The night speed limit in Montana is not only illegal because it has no factual basis under the statutory constricts of the MUTCD. The unjustified statewide application violates the prohibition found above in MUTCD § 1A-2. Moreover, it penalizes drivers who are in fact driving safely. The officer has no way of knowing each individual’s ability is to see at night or judge the relative capability of that particular vehicle’s light system to the drivers night vision capabilities. The law has no scientific foundation, only unfounded or unsupported conjecture, therefore its is an arbitrary and capricious law that violates due process.
Speed Variance:
Speed variance is in itself the number one thesis behind the need for speed limits. There is a significant factual irony in this thesis and how speed limits are used. In every relative risk chart for being involved in an accident there is a distinct bell curve relative to the flow of traffic. These charts show that the highest accident risks and undisputed clear and present public safety hazard are the slowest drivers, and then on the opposite side of the curve to a much lesser extent, are the very fastest drivers in that order.
The Speed Variance studies are urban findings, and the shape of all these risk curves are heavily influenced by flow conflict points. The problem is all speed limits are uniformly set based on the shape of these inclusive urban risk curves despite the fact that once the traffic clears the flow conflict points (onramps, intersections, too many entry points, converging highways) accident rates for all causes drop to negligible rates and the above average to faster vehicles have the lowest involvement rates in all of these studies.
More importantly, speed variance accidents in the areas away from the flow conflict points are extremely rare events… in fact any type of accident is rare. And the Montana Paradox and German Autobahn findings suggest that without limits, human nature and due caution further reduced flow conflict accidents when there are no limits at all. Therefore, in areas where speed variance is an identified problem, accident reduction efforts should be focused on slow drivers obstructing flow and minimum speed limits, rather than maximum speed limits.
In an attempt to find a smoking gun to support speed limits, the Office of Traffic Safety and the Montana Highway Patrol tried to determine the make up of the fastest vehicles.
“The Montana Highway Patrol survey of 1996 found that 60 percent of the speeders observed at speeds above 85 mph were from out of state, while 75 percent at speeds above 90 mph were from out of state.”
What the MDT response failed to mention, this study also found that these higher speed vehicles were not over represented in the accident rates. As stated above, this is a very predictable engineering finding because in every relative risk curve, the vehicles least likely to be involved in an accident are those traveling much faster than the average. In addition, once clear of conflict points, the risk curve looks more like a flat line and accidents for all causes, even higher speeds are very low risk. In these areas fatigue, sleep deficit and other physiological anomalies, animals in roadway, improperly or unmarked hazards and weather become the primary contributing cause.
Montana has more contemporary data on the effects of no limits on rural highways than anyone else in the Nation, and the “Montana Paradox” report is the only analysis that separated the data in a way that could evaluate this speed variance question.
In the MDT’s attempt to discredit this study’s release, they used “became an issue because of noticeably higher speeds, greater variances in speed between vehicles and the corresponding risks for motorists”; a hypothesis, not supported by the facts. If they had asked for their data to be separated by location and road classification, they would have discovered that with the increased speed variance, the percentage of flow conflict accidents remained unchanged on the Interstates, and they in-fact went down 5 percent on the two lane rural primary highways. The highways became safer, a factual finding opposite from their hypothesis assertion.
You said dichotomy? Yes! The least likely to be involved are those traveling well above the average or mean speed - the fastest drivers. On Interstates the safest drivers, even with flow conflict points, were those drivers traveling up to 18 mph over the average speed (Cirillo). On the Autobahn where flow management is the primary strategy, rather than speed, they have consistently reported lower accident rates than comparable US highways, despite their significantly higher speed differentials.
This is why it was so important to track what really happened in Montana. This very well may be the last time anywhere in the world that limits vs. no limits could be compared. The below is the summary of the only study of the effects of speed variance in Montana, comparing speed limits with the no daytime limits. Full report can be found at http://www.hwysafety.com/hwy_montana_2001.htm
Montana Paradox:
Summary of the effects of no daytime speed limits:
1. Fatal accident rates on these highways reached an all time low in modern times.
2. On 2 lane highways with no posted limits the frequency of multiple vehicle accidents dropped 5 percent.
3. Seat belt usage is up to 91% percent, with only a secondary enforcement law.
4. Posted limits and their enforcement, had either no or a negative effect on traffic safety.
5. As predicted by the engineering models, traffic speeds did not significantly change and remained consistent with other western states with like conditions.
6. The people of Montana and its visitors continued to drive at speeds they were comfortable with, which were often speeds lower than their counter parts on high density urban freeways* with low posted limits.
7. The theory behind posting speed limits on these classifications of highway is to reduce conflicts in traffic flow (caused by speed differential), thereby reducing accidents. On the two lane highways flow conflict accidents (multiple vehicle) decreased when the limits were removed. When added to the Autobahn results and the no change found on Montana’s Interstates, this thesis needs to be rethought because the field data on highways without posted limits doesn’t support it. With the expectation of higher speed differentials, multiple vehicle accident rates declined even when the actual speeds did not change significantly. This suggests the changes are the result of positive motorists behavior (courtesy and due caution).
8. In traffic engineering findings the vehicles traveling faster than average have the lowest accident rates, yet they are the primary targets of speed enforcement. To this we can now add, with speed limits there was no positive correlation between speed enforcement and accident rates on rural free flowing highways, if anything, the highways became less safe.
MONTANA PARADOX: Is that the desired safety effect from posting speed limits was achieved by removing them.
With fatal accidents at an all time low and speed variance accidents rates down 5 percent. There was no documented reason to establish speed limits, and the recommendations by MDT and others that the state needed them had no factual foundation whatsoever.
“one, Montana’s speed limits have been in effect for just two years, which is too short a timeframe to draw valid conclusions;”
And now with the new speed limits, despite significant new enforcement efforts, there has been a corresponding increase in fatal accidents. One valid conclusion can be drawn for sure - the highways aren’t any safer.
Nationally accepted practices:
Are those practices that are articulated as standard or guidance within the national MUTCD or adopted by reference therein. Adopted by reference are those that have been peer reviewed, accepted as guidance or recommended by AASHTO, FHWA and the ITE etc. It is not the personal opinion of an engineer or local practice, the engineer’s duty is to apply accepted national practice to the best of their ability and be able to articulate which practice they applied and why.
Here are a few guidance examples;
Federal Highway Administration
Report No. FHWA/RD-85/096 Technical Summary, "Synthesis of Speed Zoning Practice" which states:
"Based on the best available evidence, the speed limit should be set at the speed driven by 85 to 90 percent of the free-moving vehicles rounded up to the next 5 mph increment. This method results in speed limits that are not only acceptable to a majority of the motorist, but also fall within the speed range where accident risk is lowest.”
“No other factors need to be considered since they are reflected in the drivers speed choice.”
AASHTO:
A 1969 “Resolution of the annual meeting of the American Association of State Highway Officials”
states:“The review of existing practices revealed that most of the member departments use, primarily, the 85th percentile speed. Some agencies use the 90th percentile speed, and of secondary consideration are such factors as design speed, geometric characteristics, accident experience, test run speed, pace, traffic volumes, development along the roadway, frequency of intersections, etc.”
“On the basis of the forgoing review, the Subcommittee on Speed Zoning recommends to the AASHTO Operating Committee on Traffic for consideration as an AASHTO Policy on Speed Zoning that:
The 85th percentile speed is to be given primary consideration in speed zones below 50 miles per hour, and the 90th percentile speed is to be given primary consideration in establishing speed zones of 50 miles per hour or above. To achieve the optimum in safety, it is desirable to secure a speed distribution with a skewness index approaching unity”
Institute Of Transportation Engineers; (urban highways)
ITE Committee 4M-25, Speed Zone Guidelines:
“Thus, the overriding basis (from a safety perspective) for speed zoning should be that the creation of the zone, and the speed limit posted, results in an increase in the percentage of motorists driving at or near the 85th percentile speed.”
“A third rationale is the need for consistency between the speed limit and other traffic control devices. Signal timing and sight distance requirements, for example, are based on the prevailing speed. If these values are based on a speed limit that does not reflect the prevailing speed of traffic, safety may be compromised.”
“2. The speed limit within a speed zone shall be set at the nearest 5 mph increment to the 85th percentile of free flowing traffic or the upper limit of the pace of the 10 mph pace.” “In no case should the speed limit be set below the 67th percentile speed of free flowing traffic.”
The current nationally accepted practice is consistent with prior practices above, and it is now codified in the MUTCD (governing federal law).
Section 2B.11 Speed Limit Sign (R2-1)
Guidance:
“When a speed limit is to be posted, it should be the 85th-percentile speed of free-flowing traffic, rounded up to the nearest 10 km/h (5 mph) increment.”
The 85th percentile speed: role it plays in setting speed limits.
Defined as that speed at or below which 85 percent of the traffic is moving. Stated another way, the fastest vehicle whose speed is measured is the 100 percentile speed, average speed is the 50th percentile, and the slowest is the 0 percentile speed. The 85th percentile speed would be the 15th from the fastest speed measured. Even though you see references to 90th and 67th percentile speeds, the 85th is the most widely used reference to actual traffic speeds because it is also the Prevailing Speed for engineering study purposes. There is also the Pace Speed; it is the 10 mph increment that has the highest number of vehicles. The smaller the percentile of vehicle in the pace speed, the greater the speed variance factor is.
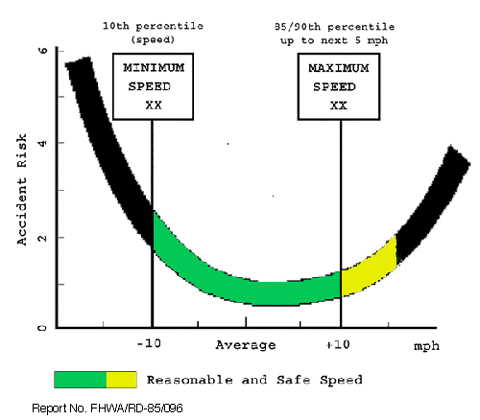
On urban surface streets and highways the 85th percentile speed of free flowing traffic has been found to be the safest speed, when the 85th exceeds 50 mph the safest speed shifts to the 90th percentile, and on controlled access highways it shifts to the 95th percentile and higher. Speed limits established on the basis of the 85th percentile on urban roadways conform to the consensus of those who drive highways as to what speed is reasonable and prudent, not dependent on the judgement of one or a few individuals.
The 85th percentile speed has also been found to be safest speed to post in urban settings. On most high volume roads, the recommendation is the 85th rounded up to the next 5 mph increment. Some jurisdictions it is the 85th rounded to the closest 5 mph increment and in school or residential districts it is the 85th percentile lowered to next 5 mph increment.
Regardless of which school of thought you subscribe to on urban street safety, there is a symbiotic relationship between determining what the public consensus is by their actions (engineer’s measurement of speed as found) and assuring that all traffic control devices are set to safely manage the flow for the speed as found for that location. Regardless of other factors, in all studies this has shown to be the most effective practice in reducing accident rates. Also, the safety record shows that with increased expectation of speed, human nature is also a large safety factor, even if speeds themselves don’t change, due caution does.
On rural highways like Montana’s, absent intersections, interchanges, converging traffic, traffic entering from parking lots etc, its importance in establishing speed limits becomes greatly diminished. The primary cause of accidents in urban setting simply doesn’t exist on rural highways. That being said, it remains the critical tool in the application of engineering judgement. Without it, safety is compromised because it is based on conjecture.
To wit: The 85th in engineering terms, is also known as the prevailing-speed that controls the specifications and design criteria for all traffic control and devices placed on that section of highway. Regardless if limits are posted or not, or what the number posted is, this finding’s numeric value remains the critical engineering basis for the marking of hazards. In towns it determines the timing of traffic lights, sign size, length of turn collectors, deceleration or merging lanes etc, in rural areas it determines the need for a curve or other hazard warnings, safe to pass/no passing zones etc. according to the conditions found on that particular section of highway.
The chart below is just one MUTCD example of how the 85th percentile is used to determine which traffic control is warranted. By knowing what the traffic is doing at that particular section of highway, the engineer adjust the devices accordingly. As with Montana where the traffic is known even faster, the below are minimums, they must lengthened until they are of sufficient length to safely regulate the traffic for that particular passing location. You can plainly see that if the device’s specifications are determined by an arbitrary posted limit that is lower than the actual prevailing speed, a vehicle may be mislead into attempting to pass, when in fact, it is no longer safe to do so.
85 Percentile Speed Minimum Passing Sight
(MPH) Distance (Feet)
25 450
35 550
45 700
55 900
65 1100
Very few miles of Montana’s rural highways actually have engineering studies, and almost all of its hazard warnings are not posted, or are improperly posted because they can’t be using the prescribed sound practices criterion, because it simply isn’t known. Most of Montana’s devices are instead posted relative to the posted limit; an arbitrarily chosen number that results in unsafe engineering practice, directly contributing to unnecessary injuries and deaths. Why, because it’s the nature of this process that arbitrary statutory limits are always lower than actual prevailing speeds. This is why the report says this action made the highways less safe, because all highway safety issues become unfounded conjecture, not fact, resulting in unsafe practices being institutionalized. If you read the history of the law, you will find out, in part, this is why Congress in 1966 outlawed such statutory limits as these, set by political conjecture.
MDT response: “During the summers of 1996 and 1997, the 85th percentile speeds on rural interstate and rural arterial roadways increased by about 5 mph compared to 1995 (up to 78 mph on the rural interstates and 72 mph on the rural arterial roadways). [The 85th percentile is defined as the speed at or below which 85 percent of the traffic is moving.]”
In reference to MDT recommendations to the legislature, if the recommended practice on busy city streets is to round the 85th percentile speed up to the next 5 mph increment... then how can low traffic volume and much safer highways end up with a recommendation of the 85th rounded down for any reason? This is what the legislature was told.
Further, the monitoring stations were 24 hour all traffic speeds, day and night, not the free-flowing speeds during the fastest times of the day (2 hour bins) for each regulated period. Without this, engineers would miss relevant spikes in traffic speeds during the fastest times of the day, speeds generally vary as much as 5 mph and more. Also Montana’s data wasn’t free flowing either; close but, any vehicle caught behind a RV, camper or vehicle towing a trailer was counted at the slower speed rather than at the speed they were going when they caught the slow moving traffic.
Without this detail or culling of corrupted data, it always results in lower than required free-flowing optimum speeds being reported. If a speed limit was determined to be justified using free-flowing optimum speeds as accepted practice mandates, this alone would cause the limit to be 5 mph or more higher. Therefore the above report excerpts were misleading because free flowing optimum passenger vehicles speeds are surely higher. Further, it is deficient in detail and the number of location specific surveys that would be required to make a factual finding for the limits they purport to justify.
In engineering practice the codified national standard starting place is the 85th rounded up to the next 5 mph increment.
MUTCD § 2B.11 Speed Limit Sign (R2-1)
Guidance:
“When a speed limit is to be posted, it should be the 85th-percentile speed of free-flowing traffic, rounded up to the nearest 10 km/h (5 mph) increment.”
Notice this sections starts with “When”, a key word because as Montanans, you know that not posting limits is accepted and safe practice. As a starting point, why weren’t the arbitrary limits set at a minimum of 80 or 85 mph on the interstates and 75 mph on the secondary highways? Why were they all much lower? The why is because it wasn’t in the self-serving interest of those advocating speed limits.
The debate around this issue is always by those who haven’t studied it. The known, regardless of the posted limits, traffic speeds remain relatively constant. Montana’s traffic will never reach the density or congestion that the following states safely regulate. The object of an engineering study is to determine what the traffic being regulated is actually doing and set the traffic control device accordingly. The California vehicle code states it best in the following section. Washington State’s comment says volumes too.
Chapter 8, California State Traffic Manual:
“Speed limits established on the basis of the 85th percentile conform to the consensus of those who drive highways as to what speed is reasonable and prudent, and are not dependant on the judgement of one or a few.”
“Further studies have shown that establishing a speed limit at less than the 85th percentile (Critical Speed) generally results in an increase in accident rates.”
Washington State DOT website:
"people don't automatically drive faster when the speed limit is raised, speed limit signs will not automatically decrease accident rates nor increase safety, and highways with posted speed limits are not necessarily safer than highways without posted limits.
Free-flowing or Free-moving:
Free flowing according the FHWA specifications is minimum 4 – 5 second unencumbered headway between vehicles. Taken at representative higher speed free-flowing sections of the roadway being studied. Speed measurement locations should not be encumbered or under the influence of intersections, curves (horizontal or vertical), lane reduction zones, hazard warnings, traffic signals or stop sign; i.e. choke points in measured speeds or flow conflict points. Minimum 500’ distance is required from a flow obstruction to the location where the speeds are measured. Further, if a vehicle enters from a side street, driveway or was otherwise impeded within this 500’ zone of influence, it should also be excluded.
The lead vehicle in a queue skews down results by unduly influencing the following driver’s natural speed choice. Therefore, all vehicles in queues are not to be counted because the lead vehicle has biased down speeds all those that follow. If you count the lead vehicle and not the others in the queue, you bias down the speed proportional by the number of vehicles whose higher speeds would have been measured if the slower vehicle had not impeded their movement. The intent of the speed measurements is to determine the actual speed of the unimpeded free flowing traffic.
The speed of traffic should not be altered by concentrated law enforcement, or other means, just prior to, or while taking the speed measurements. Caution must also be taken when measuring speeds to assure that the measurement process in itself doesn’t influence the findings. For example, cars on shoulder of highway, radar etc. has shown to result in measurably lower than actual speeds. Small samples are to be avoided, because they give an inadequate cross section of traffic speed, particularly when measured with hand held devices. These findings tend to be subjective, often used to manipulate outcome, resulting too often in unreliable data. An unsound basis, for a few man-hours saved, to establish enforcement criteria for the next 5 years.
Engineers must also consider the condition of the roadway, simply resurfacing a highway without other changes can result in increased measured 85th percentile speeds up to 4-6 mph. Further if radar or lidar is used, data collected with measurement angles greater than 15 degrees must be rejected.
Limits should not to be lowered for conditions readily apparent:
Speed limits should not to be lowered for conditions readily apparent, or to be used as intersection, curve or other hazard warning devices. This perilous practice is found as part of the Montana’s accepted practice by statute. This is a uniform national standard, even if one could point to another state that violates this section, this cannot be used as justification. Therefore, it’s a puzzlement how this known unsafe practice became codified because under the National MUTCD uniform application, if its not accepted national practice, it too is illegal under governing law.
Posting for curves or hidden hazards is to be done with advisory warning devices and downward posting for those conditions already apparent is not advised. Speed limits are posted for the free-flowing higher prevailing speed sections. Curves and hazards are to be posted with advisory warnings in proportion to the danger this specific threat represents to the approaching motorists traveling at the prevailing speeds – at sufficient distance to timely advise the motorists of the degree and nature of the approaching hazard.
California Vehicle Code and the FHWA Speed Zoning Practice both states the anti-downward zoning rationale well:
VC 22358.5
"It is the intent of the Legislature that physical conditions such as width, curvature, grade and surface conditions, or any other condition readily apparent to a driver, in the absence of other factors, would not require special downward speed zoning, as the basic rule of section 22350 is sufficient regulation as to such conditions."
Report No. FHWA/RD-85/096 Technical Summary, "Synthesis of Speed Zoning Practice" which states:
"No other factors need to be considered since they are reflected in the drivers speed choice. If there are unusual hazards not readily apparent to drivers, then a warning sign could be installed giving the nature of the hazard and, if necessary, supplemented with a realistic advisory speed."
Accident Data and Notices of Defect:
Current practice is before an engineer reviews a particular section of highway as part of an engineering study, they must also examine the accident records. Studies require a review of all relevant factors present.
There is another reason the engineer must review the accident data. As an adjunct to research on highway safety issues, independent accident investigations frequently find that enforcement agency special accident investigation and reconstruction teams often fail to report obvious geometric feature or traffic control contributing causes.
Notice of Defect is defined below. It is very clear in its meaning. Just because a minimum statutory requirement has been met, if by any means a problem becomes known to the engineer or agency, it is their professional duty to examine and mitigate it with the tools they have available through their application of engineering judgement; applying those nationally accepted practices that have been identified that may meet this need.
Traffic Control Devices Handbook, 1983, FHWA, "Notice of Defect
"An agency has a duty to correct a dangerous condition when that agency has actual or "constructive" notice of the hazard.”
Taking advantage of the Notice of Defect, another obvious method of identifying and reporting otherwise unknown problem areas became apparent - via an electronic citation database. The following email spawned the idea.
From, Bernard J. Michel, To: FHWA
“If you are at all familiar with industrial practices you will recognize the truism that ‘You can’t inspect quality into your product. It must be designed in.’ If safe highways are your product, then enforcement is your inspection. I maintain that properly designed and engineered speed limits and signal timing are the right long term solution.”
Couldn’t agree more. All literature regarding highway safety refers to the 3 E’s: Engineering, Education and Enforcement. Enforcement as utilized provides little safety benefit except in flow impediment mitigation, but in this there is an untapped opportunity to improve safety. It’s called, Notice of Defect via Enforcement. Traffic officers are tasked with writing citations and they readily find the easiest place to write citations in their respective beats. The norm of these locations is an under posted limit, confusing traffic channelization or some other defect. Therefore any location that produces noticeable repetitive citations is deemed an engineering “Notice of Defect” to be reviewed.
This enforcement practice will always be alive and well as long as officers have to write tickets, they will find the place where it is easiest. It was the nexus for the FHWA paper quoting from the 1930’s and the one from NHTSA below from 1972. These admonishments are farcical in their attempt to garner credibility by denouncing standard practice. As NHTSA metamorphosed from its original charter to its current role, these formally admonished practices are now revered practice and those that implement them are rewarded.
Excerpts from:
SELECTIVE TRAFFIC ENFORCEMENT MANUAL
International Association of Chiefs of Police, Inc.
Highway Safety Division
January 1972
Re: FHWA Library #: TEA1400.F72
U.S. Department of Transportation
National Highway Traffic Safety Administration
Washington, D.C. 20590
DOT HS-800 701
"The most visible result of quantitative, revenue-oriented, nonselective traffic law enforcement policies is the persistent use of "sitting-in" enforcement techniques. Sitting-in usually occurs at locations which, in police jargon, are referred to as "duck ponds" or "cherry patches". The sitting-in practices are particularly objectionable when two or more enforcement units group together to work an intersection which generates frequent driver violations. Usually, where this situation occurs, the officers are doing nothing more than reaping the harvest of inadequate or poor traffic engineering. These locations frequently encourage noncompliance by the motorist to traffic signals or turning regulations. Very often, however, the real culprit is faulty traffic engineering rather than the driver. Poor positioning of signals and channelization deficiencies are characteristically present at the "duck ponds".
"If sustained radar enforcement (one to two weeks on a citizen complaint and one to two months on a high accident route) fails to markedly reduce the number of violations, the help of a traffic engineer should be obtained."
"Some officers assigned to radar enforcement without explicit assignment directions will maintain their productivity levels by "milking" locations (i.e., radar enforcement for brief periods in areas which generate moderately high speed patterns for many years). This technique is not selective enforcement and it should be discouraged by traffic supervisors."
By taking advantage of this innate undesirable behavior, we can actually make our roads safer too by adding engineering “Notice of Defect via Enforcement” data to traffic engineering reviews.
Therefore, it is recommend that in addition to accident data for a particular section of highway, that the citation issuance record also be included in the engineering location review. As these deficiencies are corrected, the officers will have to find other problems to take advantage of. Then the quality control process really can work: “if safe highways are your product, enforcement becomes your inspections process” – literally.
Number of monitoring locations and speed zone changes:
You want to minimize speed limit changes by averaging the findings on contiguous sections of highway by posting uniform speed limits. Uniform limits are desired on contiguous sections, a uniform averaging of the higher speed sections is reasonable, as long as all hazards are marked. In areas where limits are warranted, if the speeds show an incremental increase in a particular direction then post the limits accordingly. Upon leaving a controlled section on the way out of a town, incremental increases provide no benefit, once clear, an end speed zone or the highway’s limit should be posted. On rural highways notice of pending limit change should be posted with adequate warning.
The FHWA workshops recommended measurements be taken every 1/2 mile for local roadways. On interstates and rural highways there should be sufficient measurement points to get a true picture of the prevailing speeds on each section being regulated with all hazards, traffic speeds and volumes, accident records by location and cause, notices of defect, roadway evaluation, mediation recommendations and devices noted.
Cost of compliance:
Engineering studies are already being certified as being done in exchange for federal highway funds being received by the state. Nevertheless, many highway agencies and localities claim it would be too great a burden to actually comply with the law.
It is not a burden on the agencies. It is rather a choice made in the allocation of resources by the posting authority. For a proper study to be done, each section may take a man hour weeks once every 5 years. On the other hand, there has been no shortage of man hours available for enforcement with multiple officers assigned to work an area, frequently on a daily basis, resulting in many man hour years being allocated over this same 5 year period to enforce unlawfully set limits.
From a highways safety perspective, by far the most effective use of funds have been the investments made in engineering reviews along with mitigation efforts to guide and facilitate traffic by reducing flow conflicts and removing hazards. Determining if a limit is needed and what the appropriate speed should be is only one component of this process.
Guide to choosing the numeric value of regulatory speed limits (R2-1, R2-2):
Prima facie: The average of the 24-hour free-flowing speed.
Absolute: The highest two-hour segment of the 24-hour free-flowing speed.
Free flowing: Minimum 4-second headway, no vehicle queues, 500 ‘ from flow impediments and no vehicles impeded within zone.
Contiguous sections: Minimize speed limit changes, set limits at average of the upper end of measured sections.
Measurement method: Not apparent to vehicles being monitored, measuring 24-hours of traffic. Radar/lidar subjective, sample too small, known to reduce registered speeds, measurement angles greater than 15 degrees unusable.
Interstates/Urban: 85th rounded up to next 5 mph increment.
Interstates and Secondary Highways/Rural: High volume highways 90th rounded up to next 5 mph increment; on low volume highways there is no justification for speed limits unless an accident pattern is present that speed limits would reduce.
Highways, business districts and arterials: 85th or upper end of pace speed rounded up to the next 5 mph increment, but in no case less than the 67th.
Minimum: 10th percentile or bottom of pace rounded down.
Residential, hospital, parks etc: 85th rounded down to the next 5 mph increment but in no case less than the 67th.
Truck: Do not post separate limits, in no limit areas 75 mph maximum; exception, special limits on downhill grades determined by that location’s experience. Generally it should begin at onset of the grade and shall end when the grade no longer presents a runaway vehicle threat. Bridges where weight is a factor shall be posted accordingly.
|

