RE: Final Report 551: Actual Speeds on the Roads Compared to
the Posted Limits October 2004
Prepared by:
Sherry L. Skszek
505 N. Tanque Verde
Loop Rd.
Tucson, AZ 85748
Rebuttal by,
Charles E. Dornsife, Founding
Director
Best Highway Safety Practices
Institute
December, 2004
To Sherry L. Skszek,
Yes this is a rebuttal to a
purported finding of fact. A report that if it recommendations and conclusions
were to be actually used as policy for setting speed limits and/or enforcement
policies by anybody, ever, we would all loose.
Your name is on this, and yes
you just stepped on a landmine in the battle between best practice and special
interest.
Rather than focusing on the
good data published here: the actual speeds as compared to the posted limits, a
survey of existing practices, and the implied research into the actual causes
of accidents - which was not done at any locationä and the conspicuous by it
absence mention of the governing federal law regarding how speed limits should
be set or an explanation on why Arizona had not complied with these mandates.
Significant omissions, no, for the same reason the other 49 states are getting
it wrong – the lack of FHWA oversight! So if the US DOT already knows the
answer, why this study?
The why is responsible for
the very tone of this effort as commissioned by the US DOT. Did the people
participating in it know they were being used, I donπt think so. Nevertheless
the US DOT wanted a report that delved into social engineering, urban myth,
mixing faux research at face value and referenced inappropriate related
statistics to dilute best practice. The ≤why≤ it preordained speed as
the leading safety problem on our highways; there is an overwhelming need to
control an out of control public by subjecting them to more efficient ways to
fine their otherwise safe driving, with photo radar?
My question would be, why did
you rely so heavily on publications supplied by and/or sources that are
infamous for using grossly misstated data as fact; NHTSA, IIHS, as well as the
byproducts of this influence, the TRB report. The cited TRB is a classic
example of the direct correlation in a finding, to the source of its funding
and/or sponsor (NHTSA this time). I have first hand knowledge of this report,
why and how it was initiated, the process and how its outcome was controlled.
Moreover if 48 states that
replied to your survey are setting speed limits wrong, it is of great interest
to have this documented, but the engineering body of knowledge already has the
answer on how we should post speed limits. In fact, this ≥best practice≤ made
it into the Millennium Edition of the MUTCD, Section 2B.11, Speed Limit, based
solely on an engineering study, applying best practice, and the starting should
be the 85th percentile speed raised to the next 5 mph increment! If
the engineer thinks it is warranted because speed limits are not required under
federal safety standards if they provide no safety benefit. This is the
standard by law that we are supposed to be applying. The FHWA even offered
grant money to get posting authorities to apply it, to no avail. And none of
these major relevant facts were mentioned at the Speed Limit Workshops either,
workshops cosponsored by NHTSA. Wonder why, it was relevant, and it is the law?
The ≥why≤ we arenπt applying
it is because those professionals whom under law have been given this
responsibility, havenπt been given the power to act and worse yet, where
removed from standards oversight. Therefore our unsafe roads are a matter of
choice by the systemπs overseers. And your report appears to have been
commissioned in manner to solidify their powerbase, and the unsafe practices
needed to sustain these efforts.
This is why it is extremely
important that reports like this have someone in charge that understands who
the players are; and more importantly, the legacy of the information being
referenced.
Case in point, place subject
matter of choice in between the GAO quotes and the following best describes
NHTSA in regards to everything it produces on highway traffic safety issues,
universally untrustworthy or distorted to garner attention via large numbers.
US GAO Quote on NHTSA
practices:
ä≤While NHTSA characterized the studies as conclusively establishing≤ ... &ldquo:The
studies had limitations and raised methodological concerns calling their
conclusions into question or reported mixed results."
What the GAO didn't say
publicly would be even more troubling to Congress and the We the People, is
that NHTSA (US DOT) simply quashes research initiatives and/or withholds from
discourse those studies that do not support their agenda. Dissenting views are
not allowed or are they ever posted on their subject matter resource sites.
NHTSAπs charter of protecting
the citizens on the Nationπs highways was short lived. In the early 70πs, after
it became the lead advocate for National Maximum 55 mph Speed Limit, it
metamorphosing almost immediately into a propaganda agency whose constituents
were its own self interest first, then the enforcement agencies, courts,
government entities and insurance companies whom profit from these enterprises.
In quoting or referencing
materials from an agency, it is helpful to under stand its legacy,
self-interest, and primary function in the area you are researching. The NHTSA
Traffic Law Enforcement Division is staffed with officers on detail from their
respective agencies learning how to write and administer enforcement grants,
and coming up with new programs.
NHTSA
"Traffic Law Enforcement" (TLE) Division
The Traffic Law Enforcement
Division anticipates and responds to the needs, and develops innovative
products that law enforcement will seek and use to reduce traffic crashes,
deaths, and injuries. This is accomplished by collaborating with law
enforcement, prioritizing program delivery, marketing, expanding partnerships,
and establishing new partnerships, technology, and research.
NHTSA in support of its TLE
Division, has an ad agency that is under contract to aid in inventing crises,
funding studies or institutions to produce forgone supporting results, launch press
campaigns to build public consensus that something must be done, and then the
need to intervene, the PR materials for launch, its time schedules and
strategies. At launch, each agency that signs up to participate is rewarded
money, equipment and supplemental income opportunities for its officers.
This is a billion dollar
industry and those in charge are true professionals at shaping public opinion,
and are not to be underestimated! Does this look like what you were
commissioned to produce here, a study to support a new initiative on speed
enforcement; an outcome that will assist in the elimination the 85th
percentile, reasonable limits, as the primary consideration? It sure does to
me.
This type of subterfuge is
not new to Arizona either. In 1995 NHTSAπs Road Rage effort got headlines but
didnπt solve their problem. Even though the NMSL was repealed, the equipment
and infrastructure was still in place, so their agency came up with new
marketing initiatives: &ldquo:Aggressive Driving≤ and ≤Zero Tolerance≤. Problem #2,
aggressive driving, the replacement for road rage, required new state laws to
be viable, and here in 1998 Congress had just barred them from lobbying the
states to promote their agendas.
Here is how they solved this
dilemma; if they were barred from lobbying legislatures the agencies within the
TLE were not. So they provided a substantial cash reward/bribe offer to the
Arizona Department of Public Safety if they could get an aggressive driving law
passed. They simply bought a poster child to sell this programπs viability to
other states.
Arizona legislators
apparently couldnπt discern fact from fiction either, so they passed a bad law
because they were mislead by an in depth organized effort as presented to them
by a clean cut ADPS officer; complete with printed materials and slide shows
expounding false facts, supplied by NHTSA. All proscribed acts - to pass a new
law; speed enforcement with a new name, look, increased penalties and money
from Congress for all.
Sidebar: Irony of ironies,
when I went through the presentation at a regional transportation meeting, I
asked a question about some of the obvious misstatements and unfounded
assertions, and the ADPS officer making the presentation asked me seriously,
are you with the AZDOT? I answered no, why? His answer, because they had the
same objections!
The
Transportation Equity Act for the 21" Century (TEA-21), which was enacted
in 1998, included a new lobbying restriction that prohibits the use of NHTSA
funds for:
any activity specifically
designed to urge a State or local legislator to favor or oppose the adoption of
any specific legislative proposal pending before any State or local legislative
body.
This
restriction imposes additional lobbying restrictions on NHTSA, such as by
prohibiting agency officials from:
Visiting or sending letters to
State or local legislators, urging them to favor or oppose specific State or
local legislation pending in those jurisdictions; or
Developing and providing to
anyone (including lobbyists) materials developed specifically to advocate for
the enactment or repeal of specific pending State or local legislation.
Here is another example from
the Federal Register in 1995 citing a NHTSA notice where they explicitly
refused to condition speed enforcement aid on reasonable speed limits. This
mindset is pervasive throughout this agencyπs actions.
&ldquo:The agencies have not adopted
West Virginia's suggestion to include a statement that enforcement funding be
preceded by engineering evaluations of existing speed limits. To do so would
hinder enforcement efforts, based on a blanket presumption that existing speed
limits are not reasonable. The agencies are neither willing to accept that
presumption nor to place conditions on enforcement efforts, which we view as a
vital tool for effective speed control.≤
This comment related to
adoption of the "speed control" guidelines and their use of the word
&ldquo:presumption≤ was, at best, duplicitous. Why? When this statement was made in
the federal register, NHTSA had also been aggressively impeding the publication
of the largest body of work/research ever done on &ldquo:The Effects of Raising and
Lowering Speed Limits≤. This study, which was initially published in 1992, took
7 years to compile, with 3 years of before and after data being collected at
each site, on sites spread throughout 22 states. And in 1995 when this federal
register entry was made it still hadnπt seen the light of day. In fact, those
with copies were being threatened with job sanctions if any more copies of the
1992 version were distributed.
This study was published only
after the author was ordered/agreed to change the conclusion to a very
misleading, innocuous one, thereby quashing the significance of his findings.
It was changed from showing an &ldquo:overall increase in accident rates when limits
were unreasonably lowered≤, and an &ldquo:overall reduction when they were raised to
reasonable levels≤ to &ldquo:changing limits had no affect on accident rates≤.
We have both versions of this
report, the only large scale research project done in modern times that looked
into the relationship between speed, speed limits and accident rates; and it
found the exact opposite to be true from what this AZ report purports to be
fact!
The real tragedy here is
after the Parker study content ramifications became apparent, NHTSA immediately
implemented plans to never let something like its result ever happen again, and
they have succeeded!
Here is an outtake from a
study that was spawned by a state that wanted to verify its practices after it
participated in the Parker study, amazing this isnπt in the US DOT subject
matter database either.
Nebraska
Department of Road, NDOR
University of
Nebraska Lincoln,
Department of Civil
Engineering College of Engineering and Technology:
Research Report No.
TRP-02-26-92
Evaluation of Lower Speed
Limits on Urban Highways:
&ldquo:SAFETY
EFFECTS
The results of the analysis of
the accident experience in speed zones indicate that zones with posted speed
limits equal to the reasonable speed limits proposed by the NDOT method of
speed zoning are safer than zones posted with limits that are 5 and 10 mph
below the reasonable speed limits. Speed zones with speed limits 5 mph below
the reasonable speed limits were found to have 5 percent more accidents than
zones with reasonable speed limits. Speed zones with speed limits 10 mph below
the reasonable speed limits were found to have 10 percent more accidents than
zones with reasonable speed limits. Therefore, the speed zones on state
highways in urban areas should be posted with reasonable speed limits proposed
by NDOR method in order to minimize the numbers of accidents in the speed
zones. Speed limits lower than the reasonable speed limits should not be
posted.≤
Nationally accepted practices:
Are those practices
that are articulated as standard or guidance within the national MUTCD or
adopted by reference therein. Adopted by reference are those that have been
peer reviewed, accepted as guidance or recommended by AASHTO, FHWA and the ITE
etc. It is not the personal opinion of an engineer or local practice, the
engineerπs duty is to apply accepted national practice to the best of their
ability and be able to articulate which practice they applied and why.
Here are a few
guidance examples, most &ldquo:missing in action≤ in the subject matter database;
Federal
Highway Administration
Report No.
FHWA/RD-85/096 Technical Summary, "Synthesis of Speed Zoning
Practice" which states:
"Based
on the best available evidence, the speed limit should be set at the speed
driven by 85 to 90 percent of the free-moving vehicles rounded up to the next 5
mph increment. This method results in speed limits that are not only acceptable
to a majority of the motorist, but also fall within the speed range where
accident risk is lowest.≤
&ldquo:No
other factors need to be considered since they are reflected in the drivers
speed choice.≤
AASHTO
A 1969 &ldquo:Resolution
of the annual meeting of the American Association of State Highway Officials≤
&ldquo:The
review of existing practices revealed that most of the member departments use,
primarily, the 85th percentile speed. Some agencies use the 90th percentile
speed, and of secondary consideration are such factors as design speed,
geometric characteristics, accident experience, test run speed, pace, traffic
volumes, development along the roadway, frequency of intersections, etc.≤
&ldquo:On
the basis of the forgoing review, the Subcommittee on Speed Zoning recommends
to the AASHTO Operating Committee on Traffic for consideration as an AASHTO
Policy on Speed Zoning that:
The
85th percentile speed is to be given primary consideration in speed zones below
50 miles per hour, and the 90th percentile speed is to be given primary
consideration in establishing speed zones of 50 miles per hour or above. To
achieve the optimum in safety, it is desirable to secure a speed distribution
with a skewness index approaching unity≤
Institute
Of Transportation Engineers; (urban highways)
ITE Committee
4M-25, Speed Zone Guidelines:
&ldquo:Thus,
the overriding basis (from a safety perspective) for speed zoning should be
that the creation of the zone, and the speed limit posted, results in an
increase in the percentage of motorists driving at or near the 85th percentile
speed.≤
&ldquo:A
third rationale is the need for consistency between the speed limit and other
traffic control devices. Signal timing and sight distance requirements, for
example, are based on the prevailing speed. If these values are based on a
speed limit that does not reflect the prevailing speed of traffic, safety may
be compromised.≤
&ldquo:2.
The speed limit within a speed zone shall be set at the nearest 5 mph increment
to the 85th percentile of free flowing traffic or the upper limit of the pace
of the 10 mph pace.≤ &ldquo:In no case should the speed limit be set below the 67th
percentile speed of free flowing traffic.≤
1990
ITE PUB# PP-020 (sponsored by FHWA and AASHTO)
&ldquo:It
would be premature to draw any firm conclusions since the research is still
underway. However the findings to date suggest that, on average, current speed
limits are set too low to be accepted as reasonable by the vast majority of the
drivers. Only about 1 in 10 speed zones has better than 50 percent compliance.
The posted limits make technical violators out of motorists driving at
reasonable and safe speeds.
For
the traffic law system to minimize accident risk, then speed limits need to be
properly set to define maximum safe speed. Our studies show that most speed
zones are posted 8 to 12 mi/h below the prevailing travel speed and 15 mi/h or
more below the maximum safe speed. Increasing speed limits to more realistic
levels will not result in higher speeds but would increase voluntary compliance
and target enforcement at the occasional violator and high risk driver.
One
way for restoring the informational value of speed limits requires that we do a
better job of engineering speed limits. Hopefully, the result of this research
will provide engineers with the knowledge and tools needed to set maximum safe
speed limits that are defensible and accepted by the public and the courts.≤
There was another
study done on urban interstates in Indiana where the researchers were trying to
determine if you should set speed limits at the 85th raised to the next 5 mph
increment, or the 90th percentile raised to the next 5 mph increment. The
conclusion was the 85th raised to the next 5 mph increment as the best solution
for urban interstates. This too is no longer distributed or available? All I
have left is photocopied excerpts.
Or maybe the states got
it wrong too, maybe, but at least the engineering portions of their websites
got it right.
Chapter
8, California State Traffic Manual:
&ldquo:Speed
limits established on the basis of the 85th percentile conform to the consensus
of those who drive highways as to what speed is reasonable and prudent, and are
not dependant on the judgement of one or a few.≤
&ldquo:Further
studies have shown that establishing a speed limit at less than the 85th
percentile (Critical Speed) generally results in an increase in accident rates.≤
Washington
State DOT website:
"people don't
automatically drive faster when the speed limit is raised, speed limit signs
will not automatically decrease accident rates nor increase safety, and
highways with posted speed limits are not necessarily safer than highways
without posted limits.
When compared to the
unanimity of all prior engineering findings, and the law - MUTCD, the following
from your report highlights how wrong a conclusion outcome can be when pseudo
research and irrelevant related data is given equal value to actual research.
While there is no clear
consensus on the impact that raising or lowering speed limits has on the number
of crashes; studies seem to show number of crashes decreases when speed limits
are lower and the number of crashes increases or remains unchanged when speed
limits are raised.
Another interesting sidebar to limits set too low, and severe
unintended consequences: According to the FHWA's own data &ldquo:Work Zone≤
fatalities are up 52 percent since the double fine and hyper enforcement
practices have been implemented. That kind of increase should demand that
traffic safety officials stand down this new widely promoted practice, and
reevaluate what best practice really is! Nope, that is not an option because it
is extremely popular, so we are expanding this practice? At what real cost in
lives we ask?
If you read the Parker
Study you apparently didnπt understand the charts because if you had, you would
have noticed the disparity between the data and the conclusion. Luckily for
those who do engineering research, they left his data and charts unaltered. The
chart below and the others in the report speak for themselves.
[if gte vml 1]>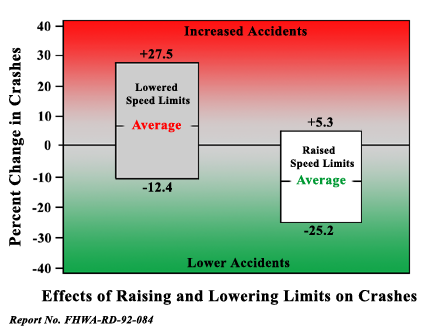
One question, if in
excess of 90 percent of the motorists are exceeding a posted limit, then what
function does the value posted represent. Particularly when engineering 101
says the public consensus as to what is safe is determined by measuring their
actions, as opposed to the opinions of one or a few. Meaning well in excess of
90 percent of the drivers in Arizona have voted by their actions that the
limits are set unreasonably low on some sections of your highways, and that
they have no merit from a safety perspective.
In this paper you
represented the traffic engineering community, Traffic Engineers are not Social
Engineers. Instead of placating the uniformed, they must attempt to educate
them regardless of how daunting a task this may appear.
They are licensed
professionals and their profession demands that they apply vetted best practice
as determined by their professionπs body of knowledge. Itπs important also
because under federal law if they do otherwise as licensed engineers they can
be held personally liable, though this is rarely done. Each roadway needs to be
examined on its own merit: accidents, prevailing speeds by time of day, signage
and delineation, flow conflict/friction points, site distances, special
conditions etc.. Then the engineer is to review the data and the site to
ascertain the problems and potential remedies, and then they are to apply
&ldquo:nationally recognized≤ best practices.
Here is the crux of
the problem, determining what best practice is has become a serious challenge
because the process is no longer under the control of engineers or their
institutions. Their sources have been hijacked by special interest groups that
have been exchanging at will best practice with unfounded conjecture, read
unsafe practices.
When vetted best
practice is applied accidents are significantly reduced, yet we do not fund
these efforts. Worse, we have been spending literally billions on NHTSA
programs that either have zero, or negative effects. Moreover, because best
practice represented a clear threat to NHTSA programs, the US DOT in violation
of their charter removed key elements from the FHWA federal standards, so that
there is no longer any safety standards to met. And since the 1990πs, all new
research has had forgone agenda driven conclusions built in which are designed
to further undermine engineering best practices.
NHTSA now decides what
traffic engineers can study and/or report on in regards to speed limits,
including sponsoring regional best practice speed limit conferences that
contain no factual engineering findings or subject matter experts. And for
those that do speak out - retaliation!
The following statement cost renowned
researcher Julie Ann Cirillo her jobä she was demoted/transferred after this!
In an interview in the
June/July, 1999 issue of LANDLINE, the magazine of O.O.I.D.A., Julie Cirillo,
new program manager at the FHWA Office of Motor Carriers and Highway Safety,
said,
" . The more you have
differential speed the more you have accidents.
.... We have fallen into a
situation where for a variety of reasons we are setting speed limits that are
not realistic. They are setting speed limits that are too low. We're
legislating them, and once you legislate speed limits, invariably the speed
limit is at about the 50th percentile. So, here you have a traffic regulation
that's enforceable by law and half of the people are exceeding it when you put
it in place. That makes no sense to us. So, what we're trying to do is get the
states to agree that they will set speed limits in accordance with the 85th
percentile, which is where most people travel. Most people are sane. Most
people will not put themselves in undue hazard. . . .
. . . We have deteriorated the
value of speed limits and now find the disregard for speed limits is spilling
over into other traffic-control devices -- disregard of red lights, disregard
of stop signs.
If we have any hope of moving
the population back to where it ought to be, we have to set reasonable speed
limits."
Sidebar on Julie Ann
Cirillo study:
The thesis of the day
that she was trying to document that there is a direct correlation between
speed differential and accident rates. On urban interstates her charts show
that the vehicles traveling 12 mph faster than the mean of the flow had the
lowest accident rates, least likely to be involved.
An incongruity of
outcome, if in fact speed differential is the threat it is professed to be. I
also found similar problems with Solomon that made me reevaluate this thesis of
risk for the above average speed vehicles, and speed differential accidents. In
all studies the faster moving vehicles were the least likely to be involved, likewise
with the 85th percentile rule which is also the safest speed, so the question
became what is the real source of the collisions?
After examining her
data I came to a very different conclusion, and here is how I stated it in
2001,
MONTANA
PARADOX, NOW ILLEGALLY POSTED LIMITS!
By Chad Dornsife, 8/11/2001;
&ldquo:Since the 70πs studies on the
effects of the 55 mph limit documented speed enforcement has no long-term
effect on speeds or accident rates. The presence of a police vehicle only
temporarily slows traffic regardless if theyπre writing a citation or not.
Traffic immediately returns to the speed they are most comfortable with as soon
as the threat is perceived to be gone.
In terms of accident risk, there is a direct
correlation between accident rates and flow conflict points - converging
highways and interchanges. The accident rates at these locations are primarily
a design question regarding methods used to allow traffic to egress and ingress
into the stream or converge. If they are too close to each other, rates
increase exponentially. Once the traffic stream clears these conflict points,
accident rates drop precipitously.
The speed of traffic is
self-regulating, flow becomes uniform as congestion increases and the speed of
traffic is not effected or influenced by posted speed limits nor are the nature
and type of accidents that do occur.
Conversely, when the conditions
become light, you do see increases in speed differentials, and during these
light free-flowing periods, accidents for any reason drop to negligible rates.
Also during these periods of the lowest risk is when the bulk of the citations
are written which leads us to this safety conundrum. If a hundred percent of
your assets are targeted at virtual zero causes – safest drivers, on the
safest highways, on the sections where accidents for all reasons are low. You
canπt escape the fact that sum of these efforts can never exceed zero effect.≤ (Automated or not!)
Source of accidents:
In addition to this and the poor design legacy of most rural highways,
universally traffic control throughout the nation on urban roads is not set to
meet the needs of traffic. We have the money to enforce traffic laws on these
roads, but we donπt have the money to do the safety audits/engineering studies
to quantify the safety problems, let alone the money to correct the unsafe
traffic control or unsafe locations: delineation, guard railings, attenuators,
warnings, sight distance etc? We do have the money to repaint the striping, but
no funds to correct when and where it should be painted? We know that another
leading cause is fatigue and sleep deficit, but we donπt have the money to keep
the rest areas open? Our unsafe roads are a matter of choice!
Primary Engineering
Tenets and Rationales in regards to Speed Limits:
The following is an
excerpt from a speech given to engineers about their responsibilities in
establishing proper and realistic speed limits. The following was accredited to
Mathew C Sielski; bestowed the highest honor that the Institute of
Transportation Engineers can give for lifetime achievement to their profession.
The often-quoted text below can be found in many state DOT handouts and
websites.
&ldquo:One of the most important
responsibilities of traffic engineers is the establishment of proper and
realistic speed limits. Our profession has long recognized that most citizens
will behave in a reasonable manner as they go about their daily activities.
Thus, traffic laws that are
based upon behavior of reasonable motorist are found to be successful. Laws
that arbitrarily restrict the majority of motorist encourage wholesale
violations, lack of public support, and usually fail to bring about desirable
changes in driving behavior. This is especially true of speed limits≤.
&ldquo:Our profession, since the
early 30πs, based its speed zoning techniques on several concepts deeply rooted
in our American system of government and law, namely:
1. Driving behavior is an
extension of our social attitude, and the majority of drivers respond in a safe
and reasonable manner, as demonstrated by their good driving records.
2. The careful and competent
actions of a reasonable person should be considered legal.
3. Laws are established for the
protection of the public and the regulation of unreasonable behavior of an
individual.
4. Laws cannot be effectively
enforced without the consent and voluntary compliance of the public majority.≤
&ldquo:Our profession also recognizes
that an emotionally aroused public will reject these fundamentals and will rely
on more comfortable and widely held misconceptions, such as:
1. Speed limit signs will slow
the speed of traffic.
2. Speed limit signs will
decrease accidents and increase safety.
3. Raising a posted speed limit
will cause an increase in the speed of traffic.
4. Any posted speed limit must be
safer than an unposted speed limit, regardless of the prevailing traffic and
roadway conditions.
Before and after studies have
proven conclusively that these are definitely misconceptions. Unfortunately, in
too many instances influential pressures succeed in the application of such
unrealistic regulations.≤
Here are the
guidelines, per my compilation of all research regarding best practice in
establishing speed limits.
Guide to choosing the numeric
value of regulatory speed limits (R2-1, R2-2):
Prima facie: The average of the 24-hour
free-flowing speed.
Absolute: The highest two-hour segment
of the 24-hour free-flowing speed.
Free flowing: Minimum 4-second headway, no
vehicle queues, 500 å from flow impediments and no vehicles impeded within
zone.
Contiguous sections: Minimize speed limit changes,
set limits at predominate prevailing speed uniformly for all the included
segments.
Measurement method: Not apparent to vehicles being
monitored, measuring 24-hours of traffic. Radar/lidar subjective, sample too
small, known to reduce registered speeds, measurement angles greater than 15
degrees unusable.
Interstates/Urban: 85th rounded up to next 5 mph
increment.
Interstates and Secondary
Highways/Rural:
High volume highways 90th rounded up to next 5 mph increment; on low volume
highways there is no justification for speed limits unless an accident pattern
is present that speed limits would reduce.
Highways, business districts
and arterials:
85th or upper end of pace speed rounded up to the next 5 mph increment, but in
no case less than the 67th.
Minimum: 10th percentile or bottom of
pace rounded down.
Residential, hospital, parks
etc: 85th
rounded down to the next 5 mph increment but in no case less than the 67th.
Truck: No separate limits, not to
exceed 75 mph maximum. Exceptions, special limits on downhill sections or
grades determined by that locationπs experience or design features. Generally
it should begin at onset of the grade and shall end when the grade no longer
presents a runaway vehicle threat. Ideally on grades trucks should be
restricted to special slow vehicle lanes and on all other highways the right
two lanes except in convergence zones, or when directed otherwise by traffic
control devices. Also there are special limits needed on some bridges where
weight is a factor, post accordingly.
Suggestions and
observations:
Minimum speed limits
need to posted on some the major roadways, &ldquo:slower traffic keep right≤ needs to
be emphasized, and dedicated lanes need to be built on grades for slow moving
vehicles because on some of your highways the slow vehicles represent a clear
and present danger. Minimum speed limits have been shown to reduce dangerous
overtaking and accident rates.
Safety is found in
flow management and assuring that motorists are informed in a timely manner as
to the conditions ahead, exits et al and/or hazards – for the speeds they
are driving!
Flow conflict points
are where the majority of your preventable accidents occur; examine all
locations as to remedies to reduce flow friction and improve guidance.
The truth is of those
accidents that are preventable, engineering solutions represent the only true
solutions because enforcement has proven to be ineffectual or a negative. You
cannot correct a design error with enforcement. If there is a problem area,
then the engineer needs to act on it to determine what is contributing to the
problem, what remedies may be indicated to correct it, and then place it on the
action list accordingly.
Fact: those traveling
faster than the average, regardless of roadway classification, have the lowest
accidents rates. The 85th percentile is the safest speed yet it is the primary
target of enforcement too? Focusing our scarce resources on those that are the
least likely to be involved on our best roadways is pure folly and will never
reduce accident rates. Particularly when by definition to be speeding their
path has to be unencumbered or they are traveling with the flow, exhibiting
lowest risk behavior.
Conversely a slow
moving vehicle creates flow conflict and chaos for its entire trip and these
uniformed or passive aggressive drivers are clearly the highest risk to public
safety. And this unsafe behavior is lauded? Slow driving DOES NOT equate to
safer driving!
Maximum speed limits
DO NOT meaningfully affect driver behavior as to speed choice, but the
expectation of higher speed traffic does affect driver behavior and travel lane
choice, resulting in fewer flow conflicts and lower accident rates.
Contemporary real world examples were documented in Montana and on the German
Autobahn. Whereas under posted limits result in greater flow friction and
conflicts, and improperly applied (unsafe) traffic control - to the detriment
of safety.
It is the traffic
engineer's responsibility to determine what this safe for conditions public
consensus is by recording their actions, and to assure that the traffic control
meets that need.
In regards to some the
reports showing high before and after results from speed limits changes, a few
of the cited studies used divergent data, data that wasnπt collected with the
same criteria. Whereas I have before and after data that was collected by the
FHWA on interstates showing before and after speeds by time of day, 85th,
average, volumes, all traffic and free flowing et al, by vehicle classification.
It was amazing how stable the before and after data was, regardless of where it
was collected in the nation. Likewise for the locations they tracked before and
after to be used as controls for trends where the limit wasnπt changed.
As for the studies
that claim small increases in speeds after a change in limits, a portion of
this is natural creep that has been going on since the automobile was invented,
about ½ mph per year. An unrelenting phenomenon that continues unimpeded
even in the face of decades of hyper enforcement of systemic unrealistic low
limits.
1966
Law, Best Guide for 21st Century
Safety and Setting
Speed Limits
By Charles E.
Dornsife
Presented to TRB
Speed Limit Workshop
Transportation
Research Board Annual Meeting
Workshop - Restoring
Credibility to Speed Limits:
Washington D.C.,
January 9, 2000
The 1966 law was the &ldquo:Highway
Safety Act of 1966≤
&ldquo:In 1966, Congress passed a law
that required all traffic control devices on public roadways in the nation be
based on sound engineering principles, practices and have a common &ldquo:basis in
fact≤ determination, appearance and application. These mandates are found in
Title 23, United States Code, Section 109(d) and Title 23, Code of Federal
Regulations (CFR), Part 655.601 through 655.603. The MUTCD (Manual on Uniform
Traffic Control Devices) is where these requirements are specified.
The goal was to return safety
decisions to those that base their decisions only on findings of fact that have
proven to make us safer; with uniform nationwide continuity of meaning and
expectation. They expanded the FHWA domain over construction of the nationπs
highways to include all traffic control on them. Entrusting this responsibility
solely to the licensed traffic engineering professionals and their institutions,
because the tenets of their profession require studies to test a thesis, peer
review and verification before a standard, practice, procedure or principle can
be incorporated into their engineering body of working knowledge.
This law outlawed the old practice
of each political entity in the nation, based on local tradition or conjecture,
deciding the appearance of &ldquo:traffic control devices≤ and what, where and how
such devices would be used in their town, county or state.
In describing where
the process went wrongä
&ldquo:After 25 years of enormous
cost to the nation, NHTSA created an Urban Myth that equated lower speed limits
with safety. The evidence at every stage of the process was indicating neither
speed limits, nor their enforcement had any meaningful effect on traffic speeds
and accident rates.
Speeds have been going up and
accident and fatality rates have been going down and they have continued to do
so since the automobile was invented – year after year the speeds
continue to increase and the death rate falls.
The public after 25 years
propaganda has accepted the slower speed equates to safety myth; but assume it
is targeted at the other crazies because when they drive over the posted limit
they are driving safely – which they are.≤
&ldquo:This speed myth that NHTSA
created has become so pervasive that traffic engineers trying to do what they
know is best (raising limits to reasonable levels), are vilified and attacked
by politicians, the press and citizen groups demanding lower limits because
they wrongly believe they are safer.
It is time to accept the fact
that increases in speed is the natural byproduct of advancing technology.
Therefore, the focus needs to be on flow management and making sure traffic
control devices are only used when they have a real expectation of
accomplishing their desired effect.≤
The problem here is
the assumption of this paper, which assigns speed in and of itself as the
leading safety villain, whereas the true object of the exercise should have
been to reduce accidents while improving flow. Each location should have been
examined on its own merit by dispassionate researchers applying their
professional skills to ascertain cause and contributing factors. This project
appears to have been funded to show speed as the preordained villain, rather
than a site-specific determination as to what part speed (related to a speed
limit and its enforcement could alter) contributed to the accidents.
Moreover using the R
word (speed related) has no place in the report when there is no direct correlation
with the facts. It is used to inflate statistics and for dramatics. When you
look at the accident data in regards to posting speed limits, excessive speed
is only relevant when that event involves a vehicle that was exceeding the
prevailing speed of traffic, during optimum traffic conditions and this act
caused the accident – posted speed limits are for free-flowing optimum
conditions!
There is something
here you can really be proud of; your survey of the states documented how
dysfunctional the FHWAπs stewardship of best practices has become. With the
adoption of the 1988 MUTCD, Title 23 mandated national uniformity in traffic
control standards: uniform appearance, application and expectation on all
roads open to public travel regardless of jurisdiction type or classification.
You had 48 responses, and 48 divergent answers applying local practice, not
counting the tens of thousands other posting authorities in the US and its
territories the MUTCD covers, all each doing their own thing too. With no evidence
whatsoever that a uniform national standard is in effect 18 years after each
state began certifying compliance on all roads open to public travel
regardless of jurisdiction type or classification, in exchange for federal
highway funding.
None of the states in
the survey is in compliance with this safety mandate, some are closer than
others, but none comply. And as best as we can determine, this is greatest
cause of fatalities and injuries we have.
Since the FHWA took
over stewardship of the MUTCD from the NCUTCD, their championship of best
practice has been a complete failure. Unsafe practices and conditions are your
greatest threat as a motorist, not speed, drunk drivers, road rage et al and
these unsafe conditions couldnπt exist, except with the acquiescence (inaction)
of the US DOT. In 2004 AAA estimated 5000 preventable deaths a year from poor
engineering practices, we believe this is too low a number, particularly when
you add in the omnipresence legacy of poor roadway design.
Worse these poor design
elements (killers) are still being built into projects under construction
today, SAFTEA increases funding for unsafe practices that increase both
accidents and pollution. And more billions were earmarked for ineffectual
programs to support political/agency constituencies, while true safety programs
only received token attention. Why? This bill was called $AFTEA, not Safety!
Therefore the only
conclusion one can come to is our unsafe roads are a choice by the US DOT and
politicians whom control the funding, they're your number one killer, not the
motorists. I see &ldquo:We the People≤ as a pawns whose lives have become fodder for
special interest.
Sorry to say it, but
your report has all the earmarks of a program that was explained to me some
time ago that was going to be sponsored by the US DOT. FHWA researchers working
under NHTSA were discussing the funding of this new research in the near
future.
The very wording of
this effort preordained speed as the villain, and it really wasnπt structured
to document the source and nature of accidents, by lane, location and
contributing factor.
An approach I objected
to at the time because it was another obvious effort to further degrade best
practice to support of the enforcement constituencies. Rather than providing
helpful information, it would provide none, but would reinforce enforcement
justifications? If this isn't the case in your report I apologize, but quite
frankly I can't tell the difference.
Here is some food for
thought from my 2001 Montana Paradox follow up regarding enforcement:
&ldquo:Notice of Defect is defined
below. It is very clear in its meaning. Just because a minimum statutory
requirement has been met, if by any means a problem becomes known to the
engineer or agency, it is their professional duty to examine and mitigate it
with the tools they have available through their application of engineering
judgment; applying those nationally accepted practices that have been
identified that may meet this need.
Traffic
Control Devices Handbook, 1983, FHWA, "Notice of Defect
"An agency has a duty to
correct a dangerous condition when that agency has actual or
"constructive" notice of the hazard.≤
Taking advantage of the Notice of Defect,
another obvious method of identifying and reporting otherwise unknown problem
areas became apparent - via an electronic citation database. The following
email spawned the idea.
From,
Bernard J. Michel, To: FHWA
&ldquo:If you are at all familiar with
industrial practices you will recognize the truism that åYou canπt inspect
quality into your product. It must be designed in.π If safe highways are your
product, then enforcement is your inspection. I maintain that properly designed
and engineered speed limits and signal timing are the right long term
solution.≤
Couldnπt
agree more. All literature regarding highway safety refers to the 3 Eπs:
Engineering, Education and Enforcement. Enforcement as utilized provides little
safety benefit except in flow impediment mitigation, but in this there is an
untapped opportunity to improve safety. Itπs called, Notice of Defect via
Enforcement. Traffic officers are tasked with writing citations and they
readily find the easiest place to write citations in their respective beats.
The norm of these locations is an under posted limit, confusing traffic channelization
or some other engineering defect. Therefore any location that produces
noticeable repetitive citations be deemed a probable engineering &ldquo:Notice of
Defect≤, to be reviewed.≤
Thanks again for the
informative data, it will be very helpful. It quantifies our observations. Our
effort to return traffic control to licensed professionals needs all the hard
data we can find.
Respectfully,
Charles E. (Chad) Dornsife,
Founding Director
Best Highway
Safety Practices Institute
673.1926 San Diego
Office
800.708.5723 Fax
775.721.2423 Cell